Home › Atlas › Figures

Figures

The figures of the Microbiome Repo resource manuscript (in preparation), built from the catalog's own tables. Click a figure for the full-resolution image.
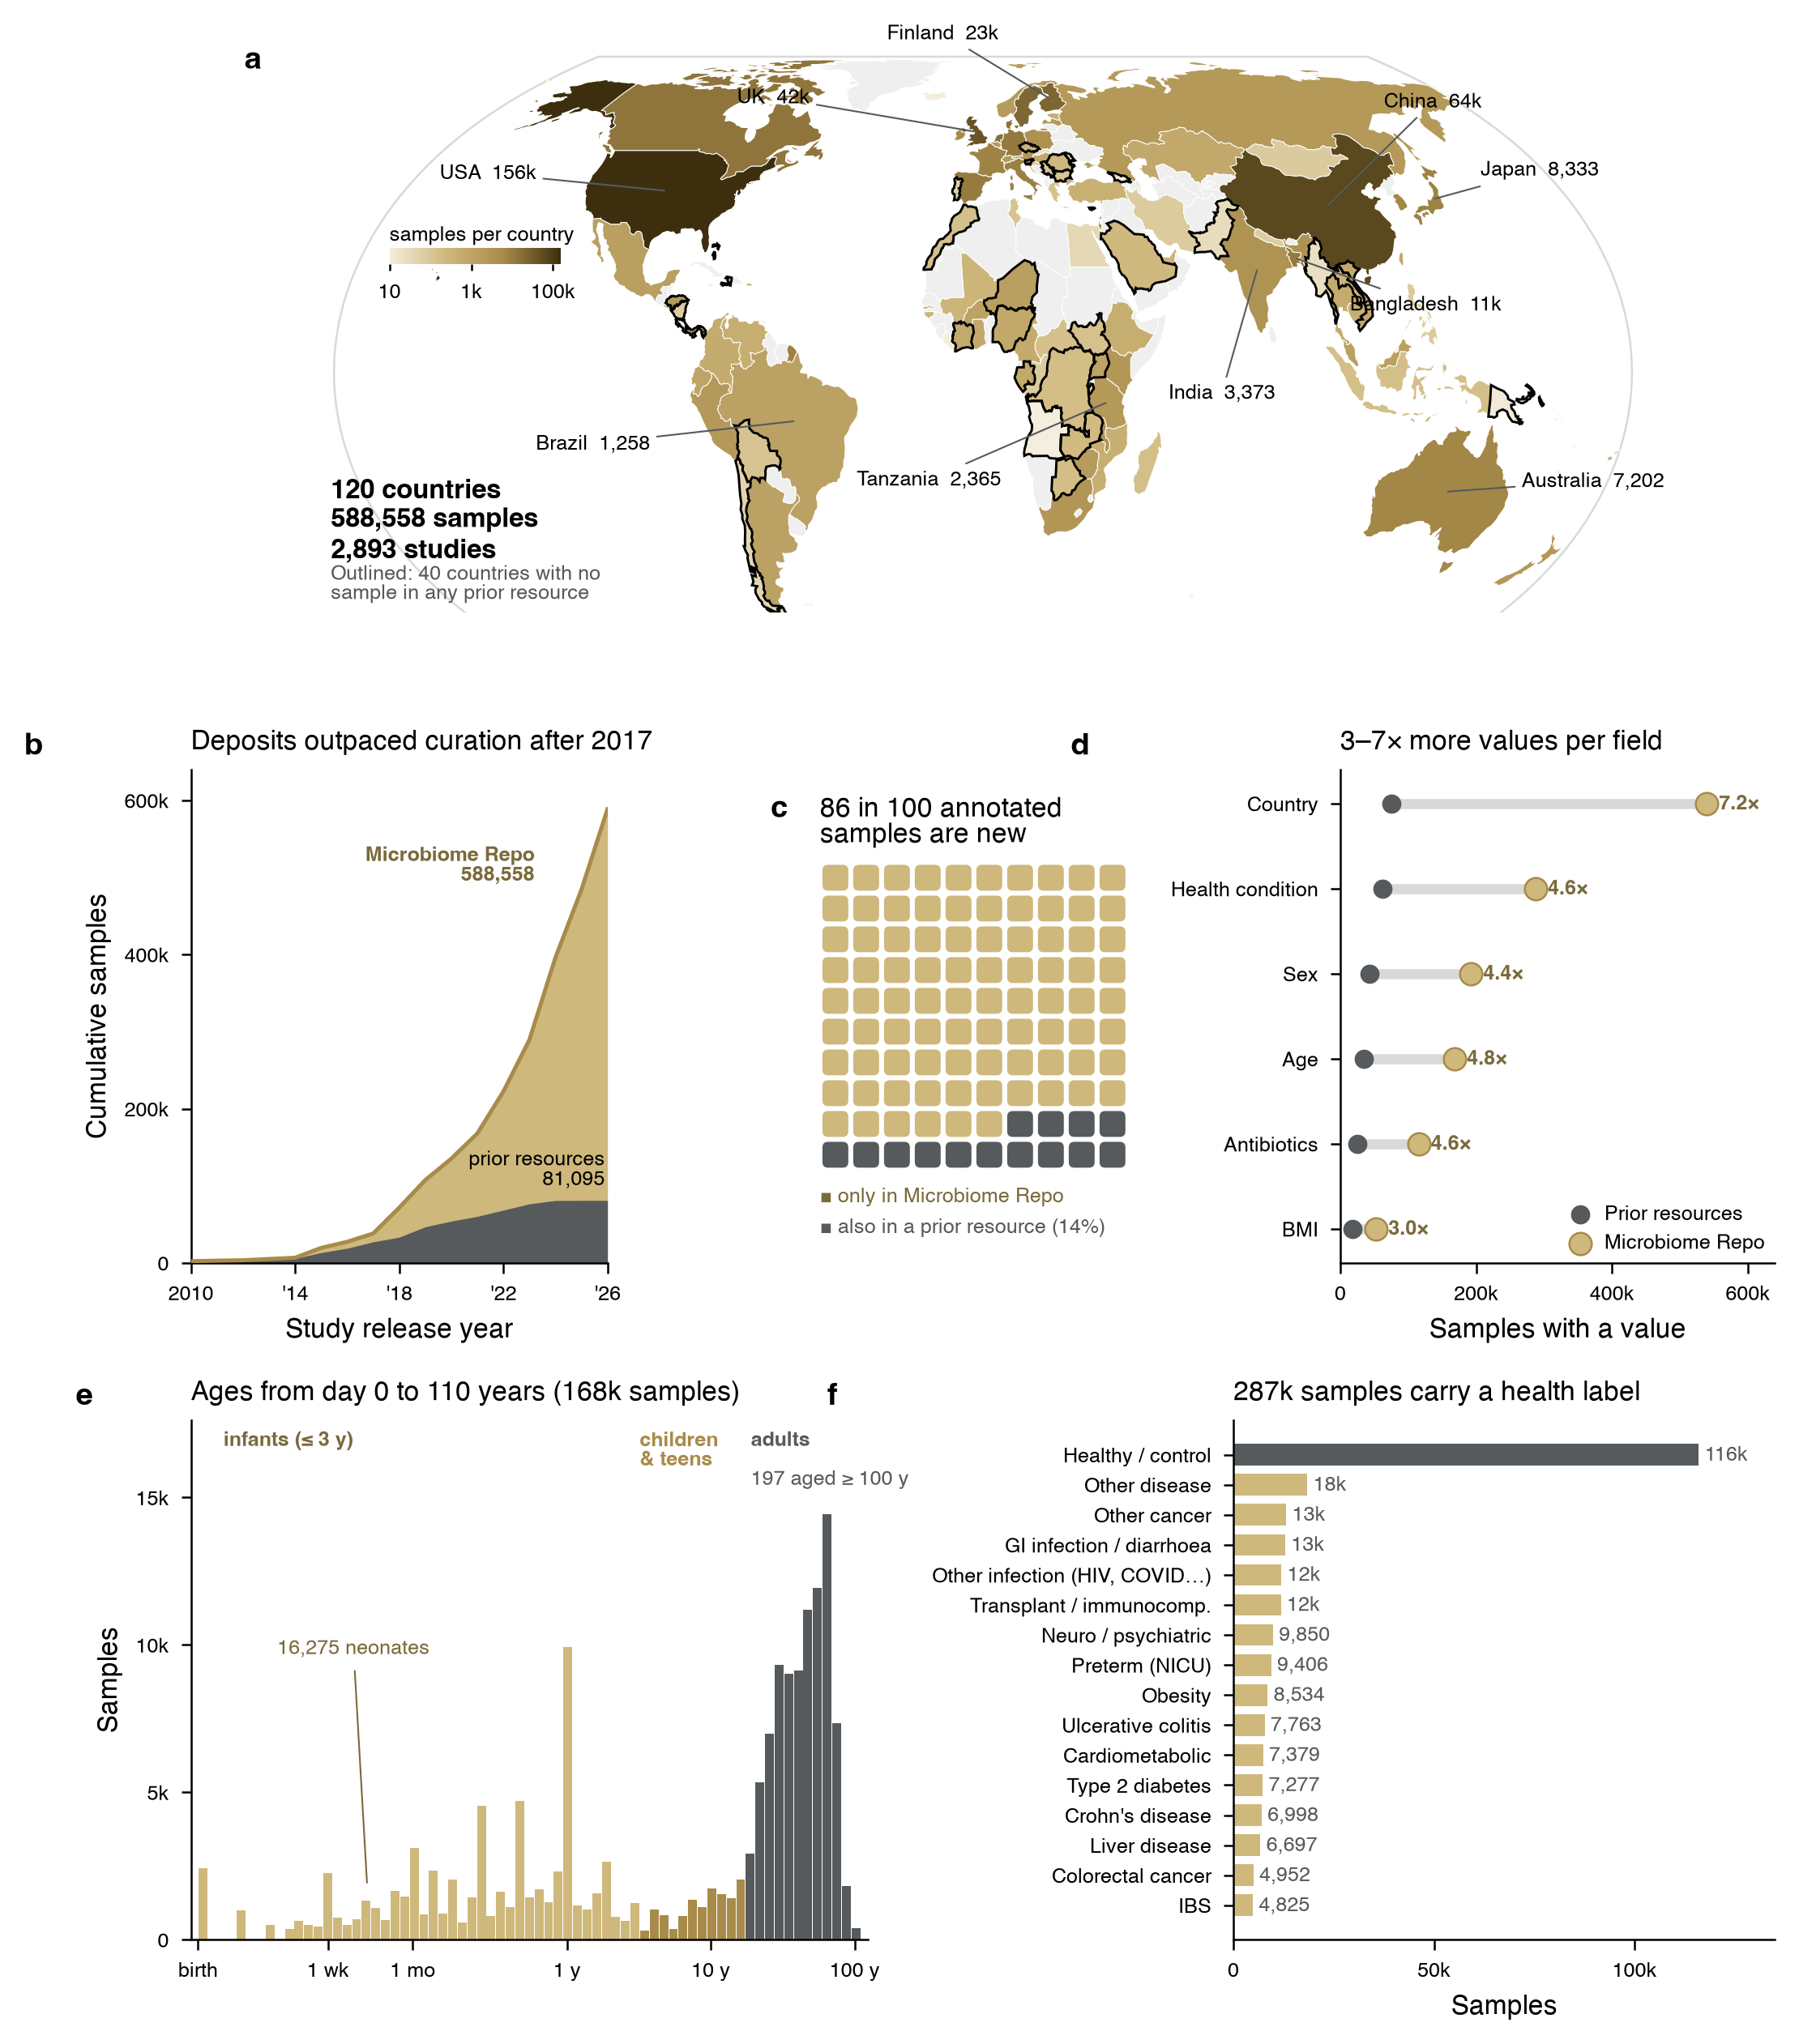
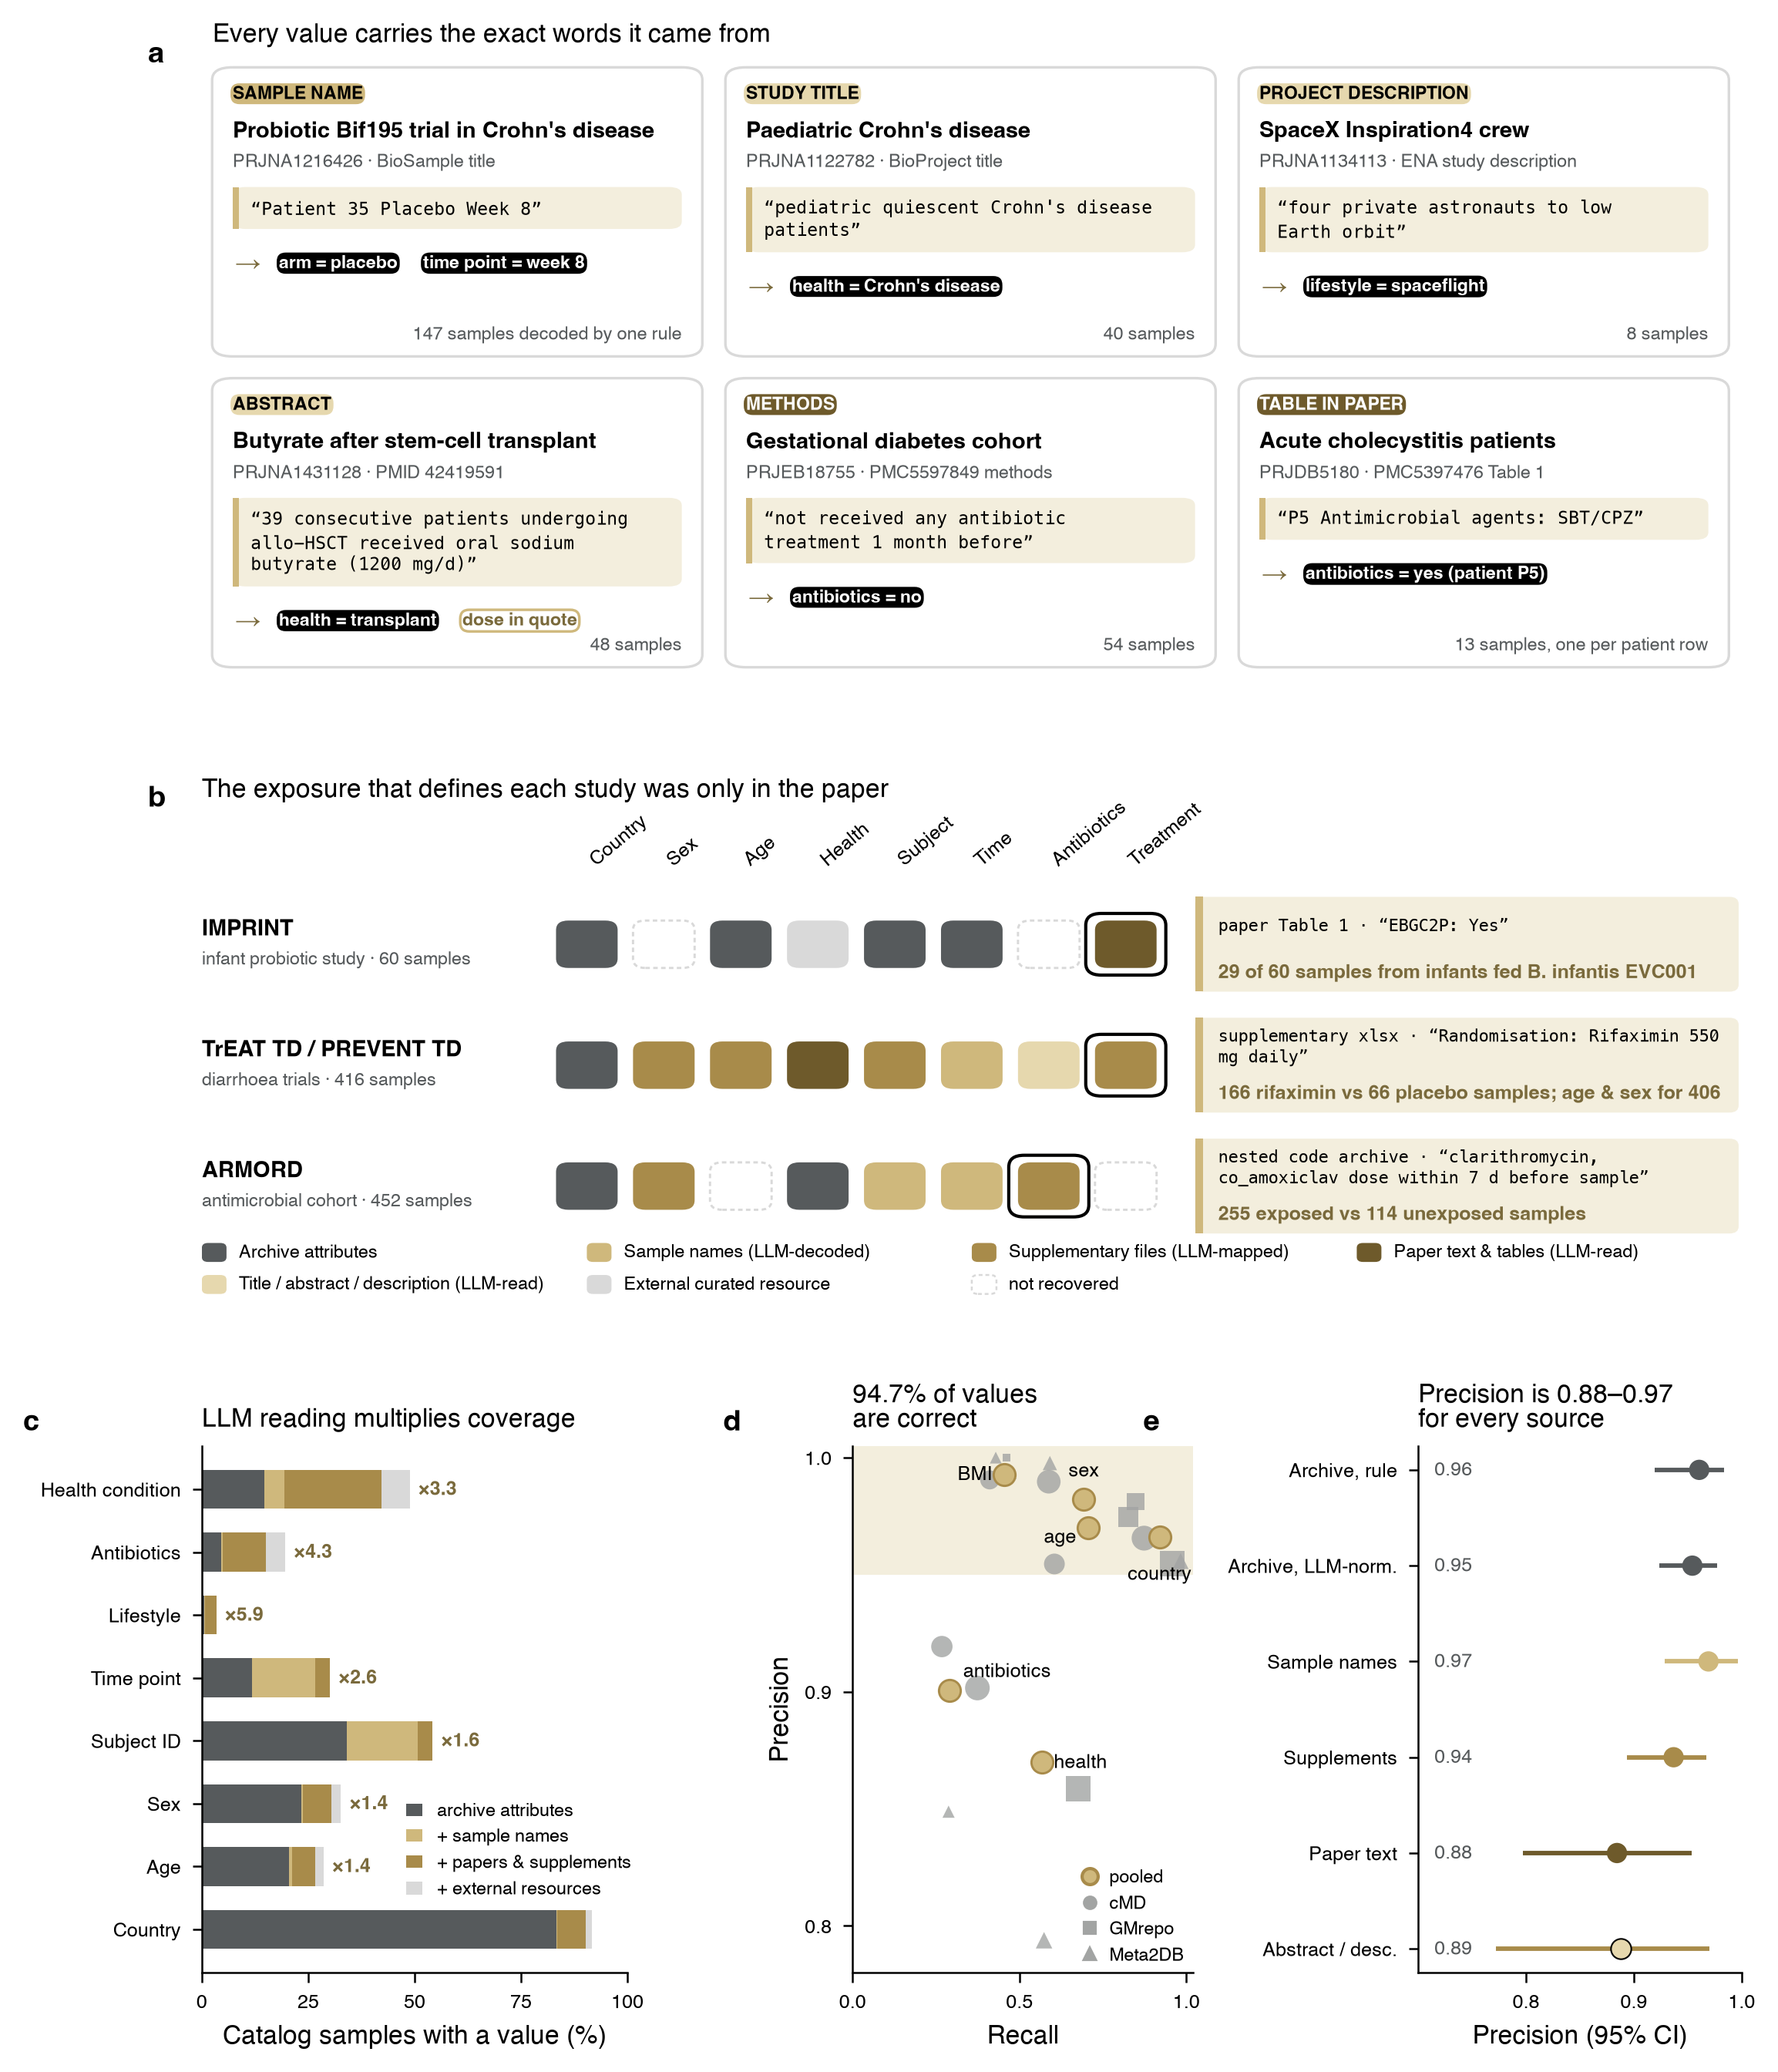
Figure 1. Microbiome Repo is larger, broader and more current than existing resources.
Figure 1. Microbiome Repo is larger, broader and more current than existing resources. (a) Catalog samples per country (Equal Earth projection; colour scale is logarithmic). Black outlines mark the 40 countries with no sample in any of nine prior resources. (b) Cumulative number of catalog samples by the year their study was first made public (gold), and the number also annotated by a prior resource (grey). 2026 is incomplete (through 29 September). (c) Of samples with at least one host value (age, sex, BMI, country, health condition or antibiotic exposure), the share that has a host value in any prior resource; each square is 1% of 575,335 samples. (d) Samples with a value for each host field in the union of prior resources (grey) and in Microbiome Repo (gold); numbers give the fold difference. (e) Age at collection for the 168,338 samples with an age, on a logarithmic axis from birth to 110 years. (f) The most common health-condition codes (of 29); "healthy / control" is shown in grey.
Figure 2. Reading papers with LLMs recovers metadata that is not in the archive, and the values are accurate.
Figure 2. Reading papers with LLMs recovers metadata that is not in the archive, and the values are accurate. (a) Examples of evidence quotes behind catalog values, one per source: a BioSample title, a BioProject title, an ENA study description, an abstract, a methods section and a table in the paper. The badge colour gives the source, as in (b–e). The number of catalog samples that receive the value is shown in each card. (b) Source of each field for three studies whose defining exposure (boxed) is absent from the archive record. Squares are coloured by the source of the field's values; dashed squares mark fields with no value. The quote and result for the boxed field are shown on the right. (c) Share of catalog samples with a value for each field, built up from archive attributes alone, then adding decoded sample names, then papers and supplementary files, then external resources. Numbers give the fold increase over archive attributes. (d) Precision and recall of values produced by the pipeline against three independently curated resources, after removing values ingested from those resources. Grey symbols show each reference, sized by the number of reference values (shown when ≥ 100 values were compared); gold circles show pooled estimates (218,218 reference values, 60,389 samples, 370 studies). The shaded band marks precision ≥ 0.95. (e) Precision of values from each source against the pooled references, with 95% confidence intervals from resampling studies.
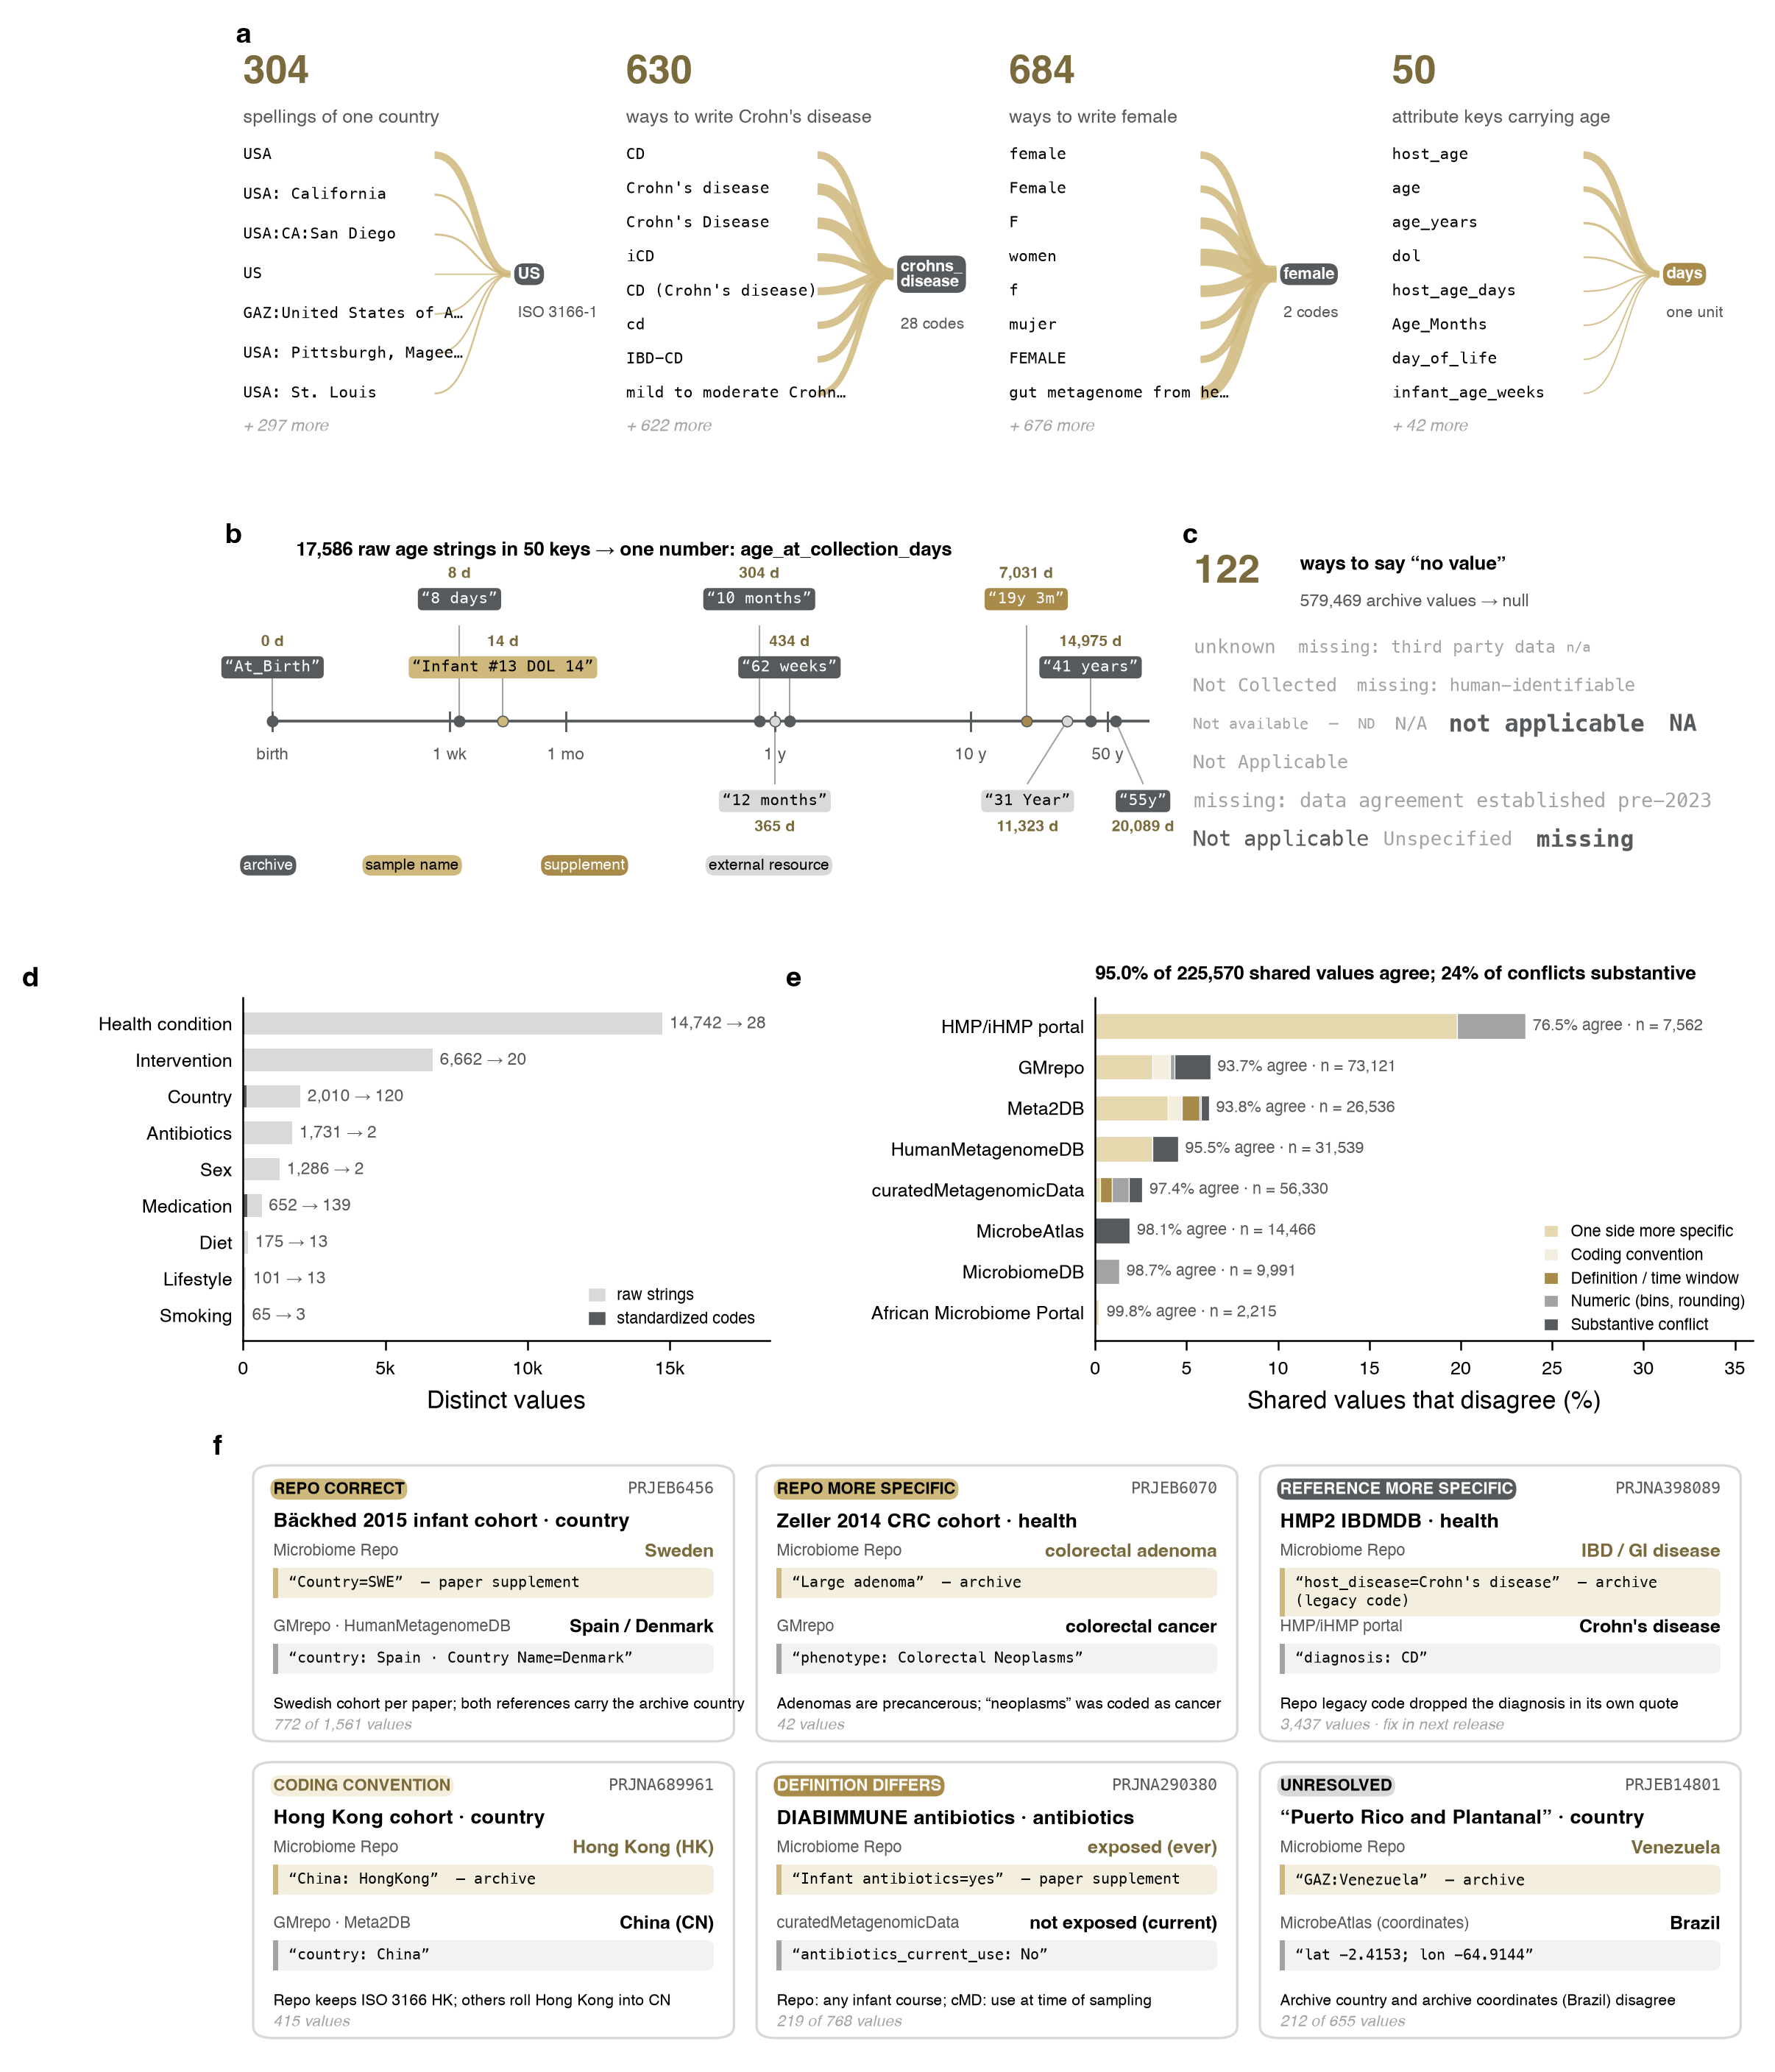
Figure 3. Microbiome Repo standardizes free-text metadata and makes conflicts between resources visible.
Figure 3. Microbiome Repo standardizes free-text metadata and makes conflicts between resources visible. (a) Distinct raw strings that map to a single standardized value, for country (United States), health condition (Crohn's disease) and sex (female), and distinct attribute keys that carry host age. Line width scales with the number of values written each way; examples include a BioSample title from which sex was decoded. (b) Examples of raw age strings converted to age at collection in days, placed on a common logarithmic axis. Colour gives the source. (c) The 30 most frequent of 122 placeholder strings for missing data, sized by frequency. (d) Number of distinct raw strings and standardized codes per field. (e) Disagreement between values produced by the pipeline and values from each external resource on the same samples, as a percentage of shared values, coloured by type of disagreement. (f) Adjudicated examples of conflicts, each showing the value and evidence quote from Microbiome Repo and from the external resource, with the verdict and its basis.
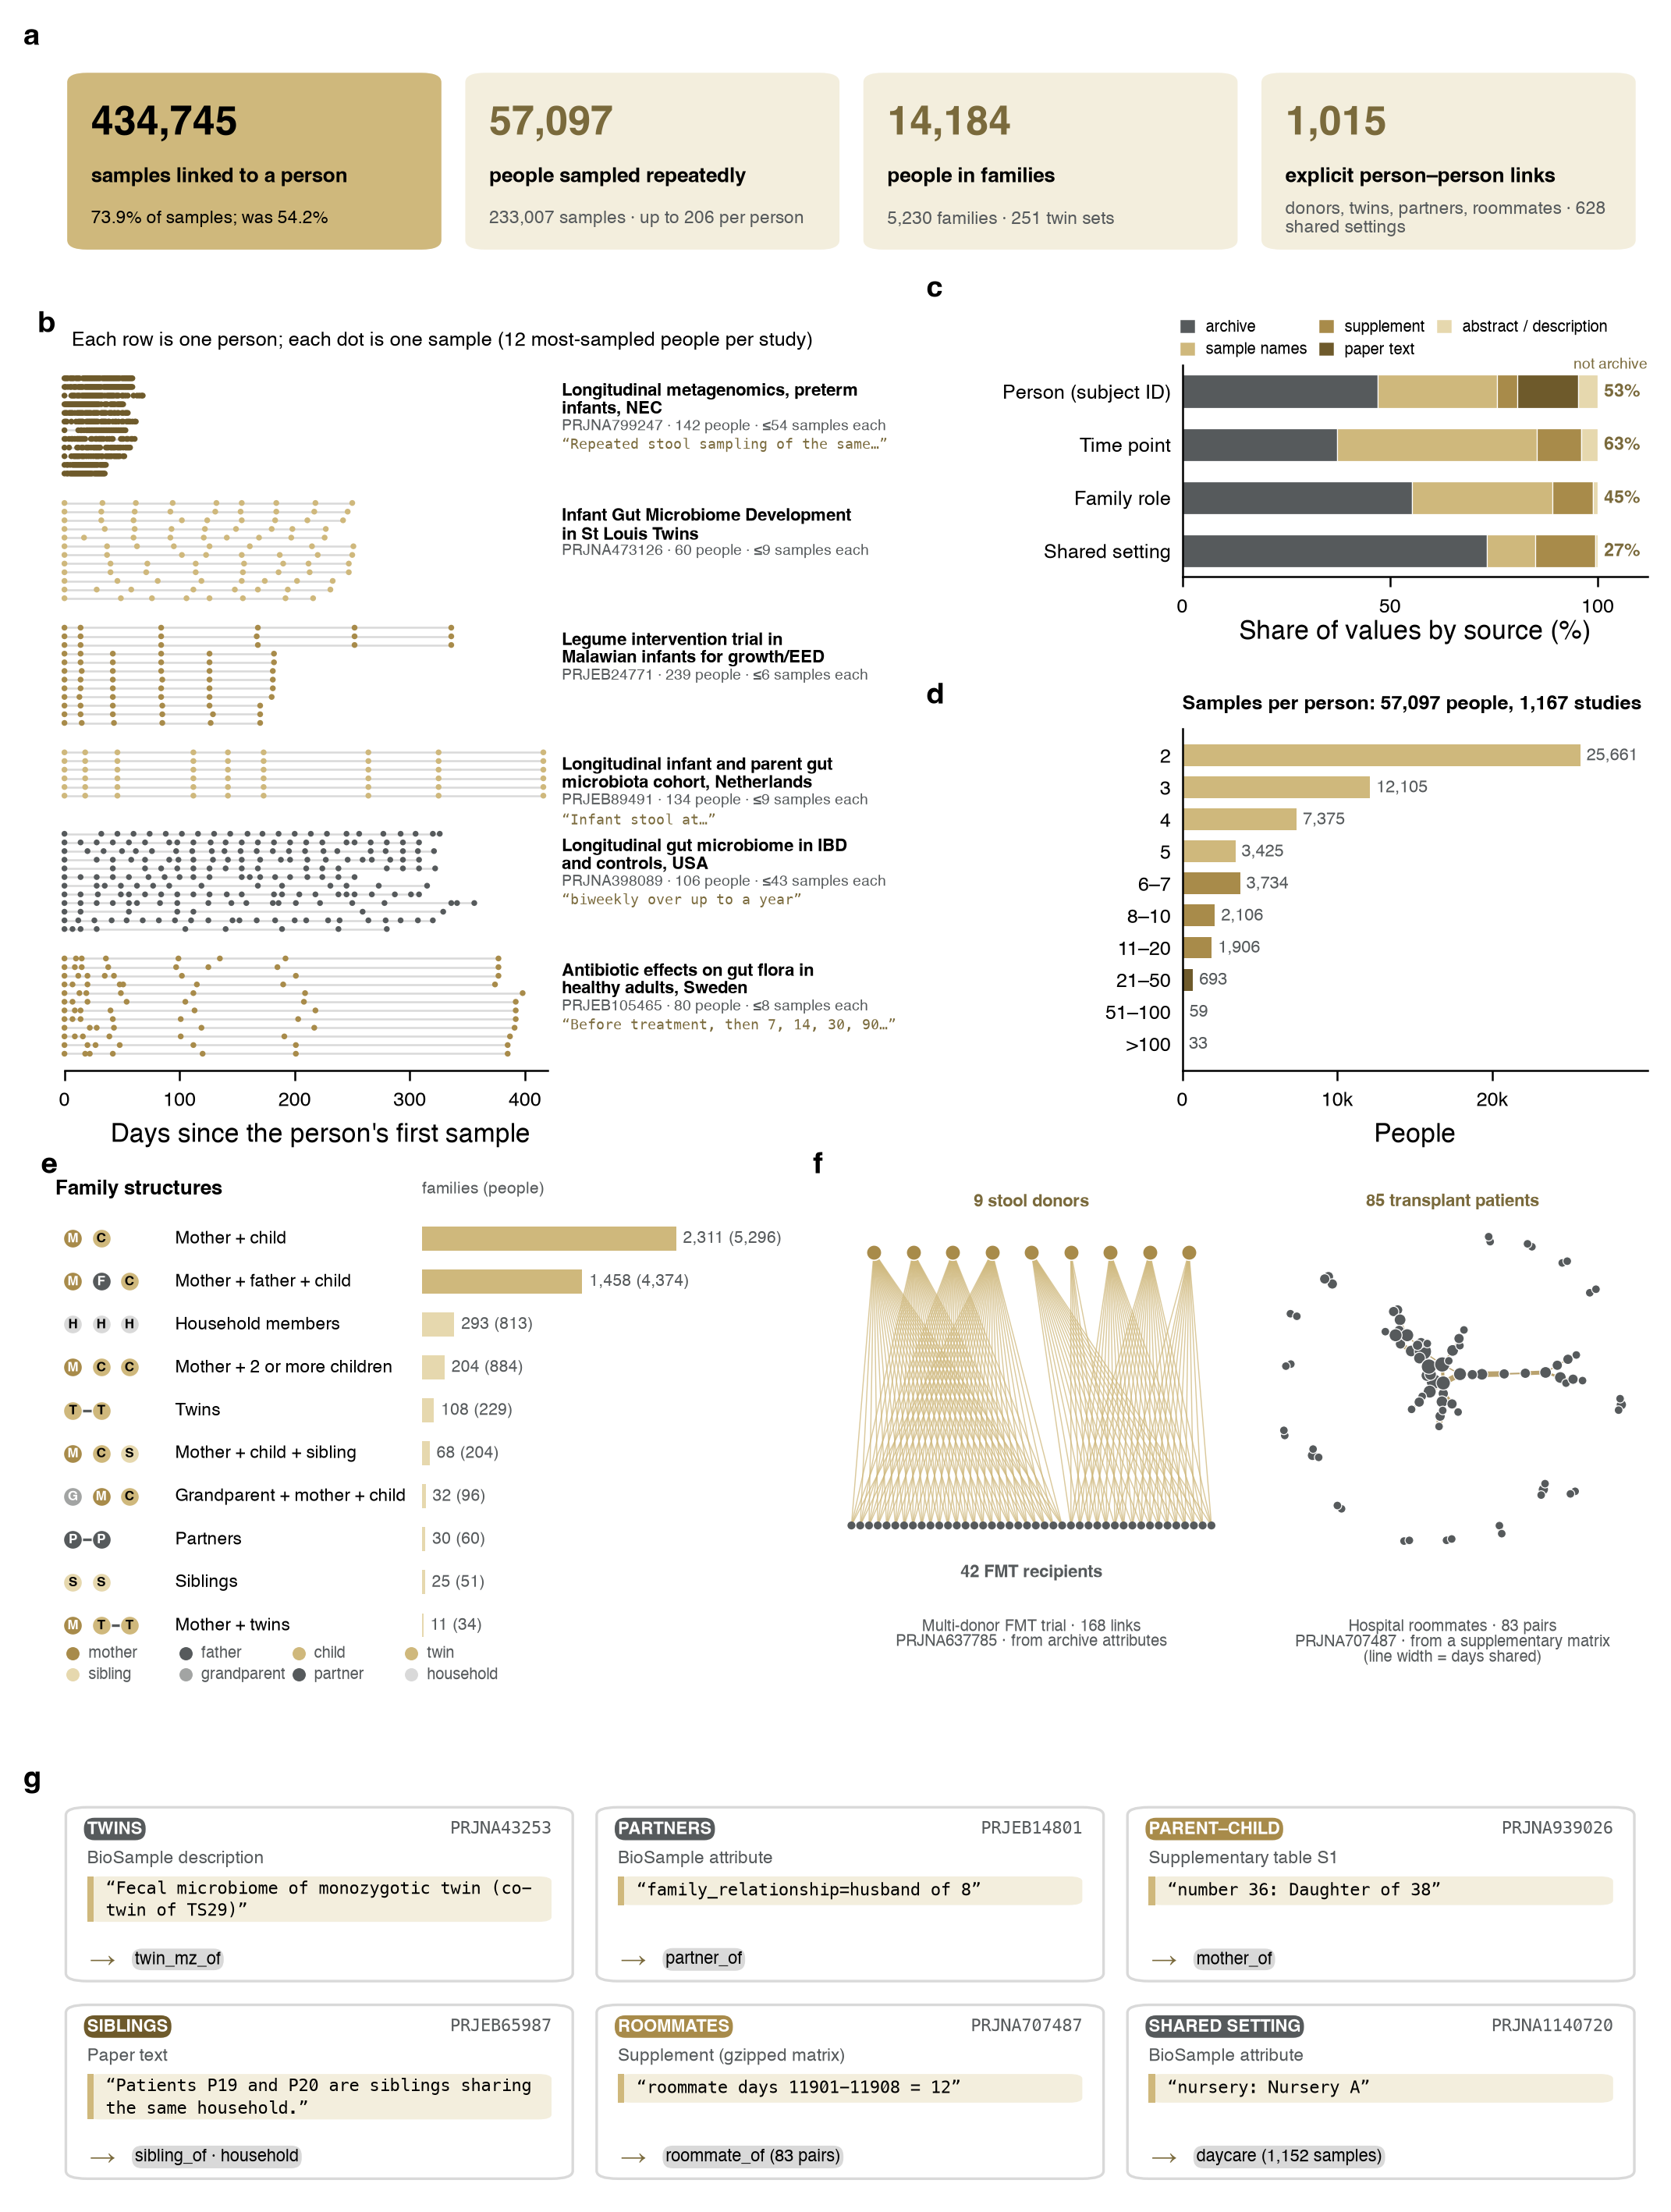
Figure 4. Microbiome Repo links samples to people, time and relationships.
Figure 4. Microbiome Repo links samples to people, time and relationships. (a) Summary of person, longitudinal and relatedness annotations in release R2026.23. (b) Sampling timelines for six longitudinal studies; each row is one of the 12 most-sampled people in the study, and each dot is one sample, placed by days since that person's first sample. The study's sampling schedule, as quoted from the paper or archive, is shown on the right (truncated). People with implausible follow-up times were excluded (Methods). (c) Source of the values for person, time point, family role and shared setting. Numbers give the percentage not derived from archive attributes. (d) Number of samples per person among the 57,097 people sampled more than once. (e) Family structures, with the number of families and, in parentheses, people. Circles show the roles in each structure. (f) Two relationship networks: stool donors and recipients in a multi-donor faecal microbiota transplantation trial (PRJNA637785), and hospital roommates among transplant patients (PRJNA707487), with line width proportional to days shared. (g) Examples of evidence quotes for relationships, coloured by source as in (c).
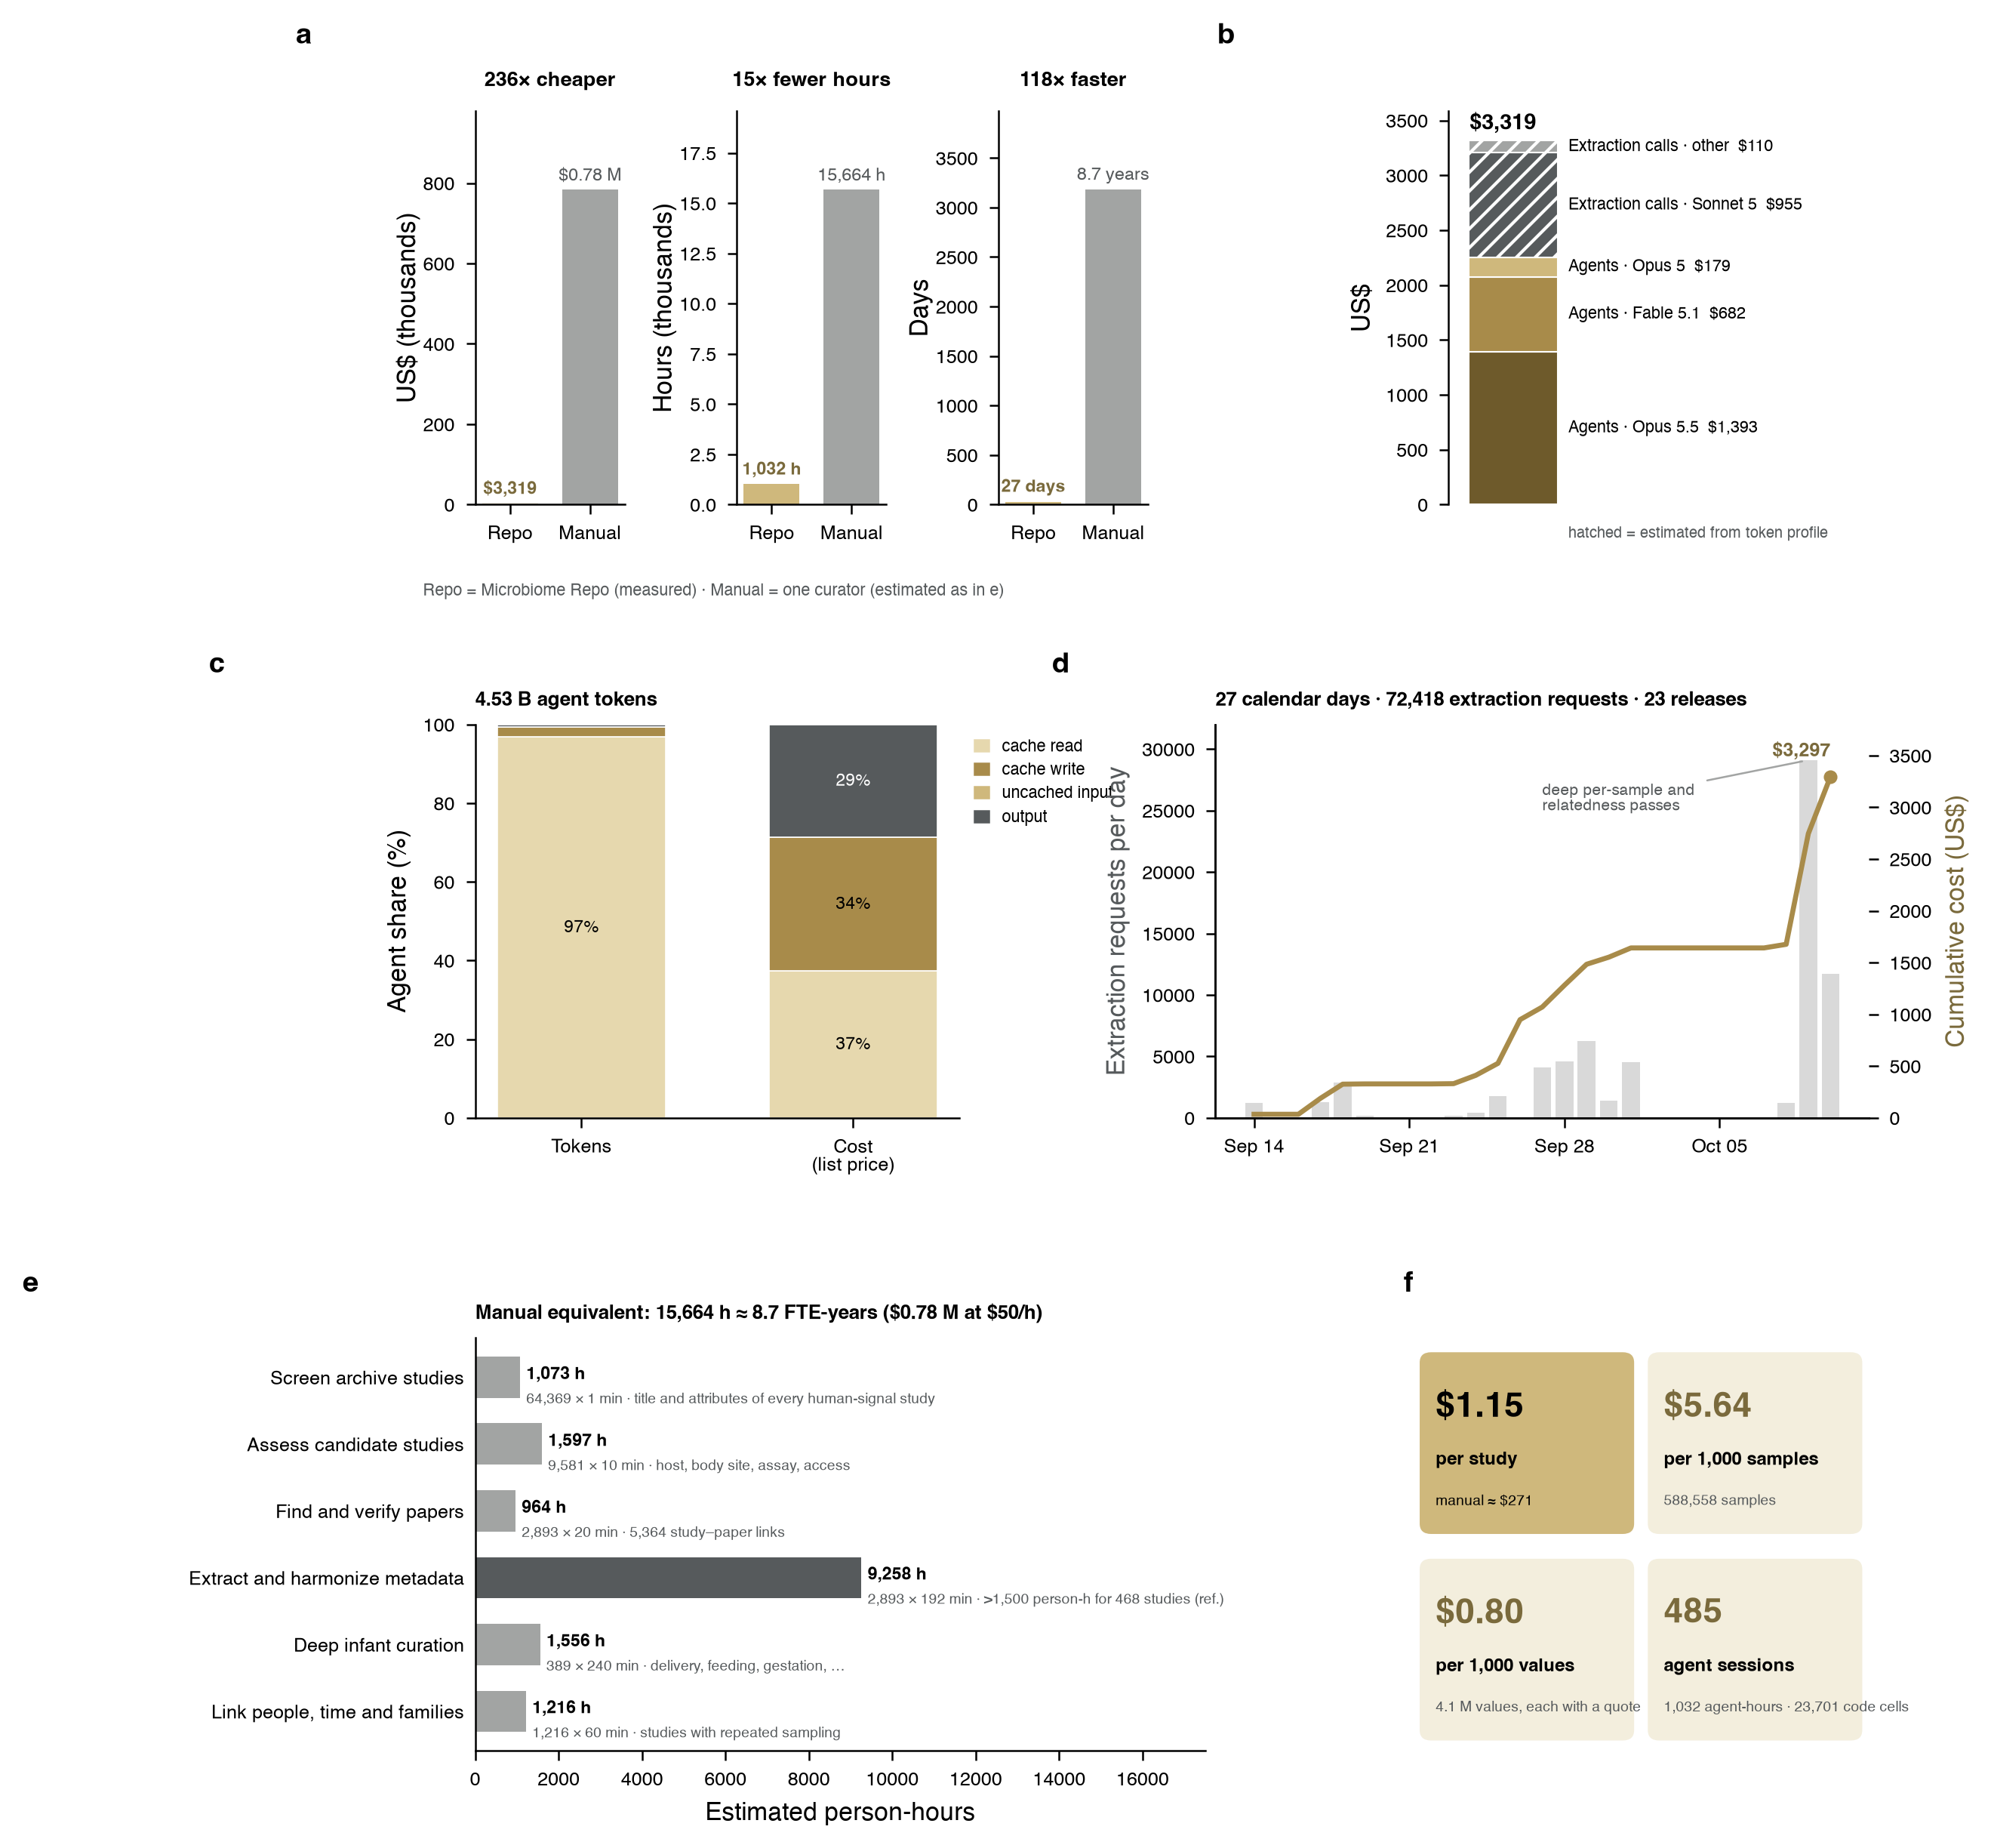
Figure 5. Cost and effort.
Figure 5. Cost and effort. (a) Cost, effort and calendar time for Microbiome Repo (measured) and for manual curation by one curator (estimated as in e); linear axes; the panel titles give the ratio. (b) Cost by component. Agent costs are as recorded by the platform; extraction-request costs (hatched) are estimated from the per-request token usage of 2,773 requests with recorded usage, at list prices. (c) Agent tokens and their cost by token type, at list prices. (d) Extraction requests per day (bars) and cumulative cost (line). (e) Estimated person-hours for manual curation, by task. The rate for metadata extraction and harmonization (3.2 h per study) is taken from a manual harmonization of 468 studies; the other per-unit times are assumptions. (f) Unit costs.
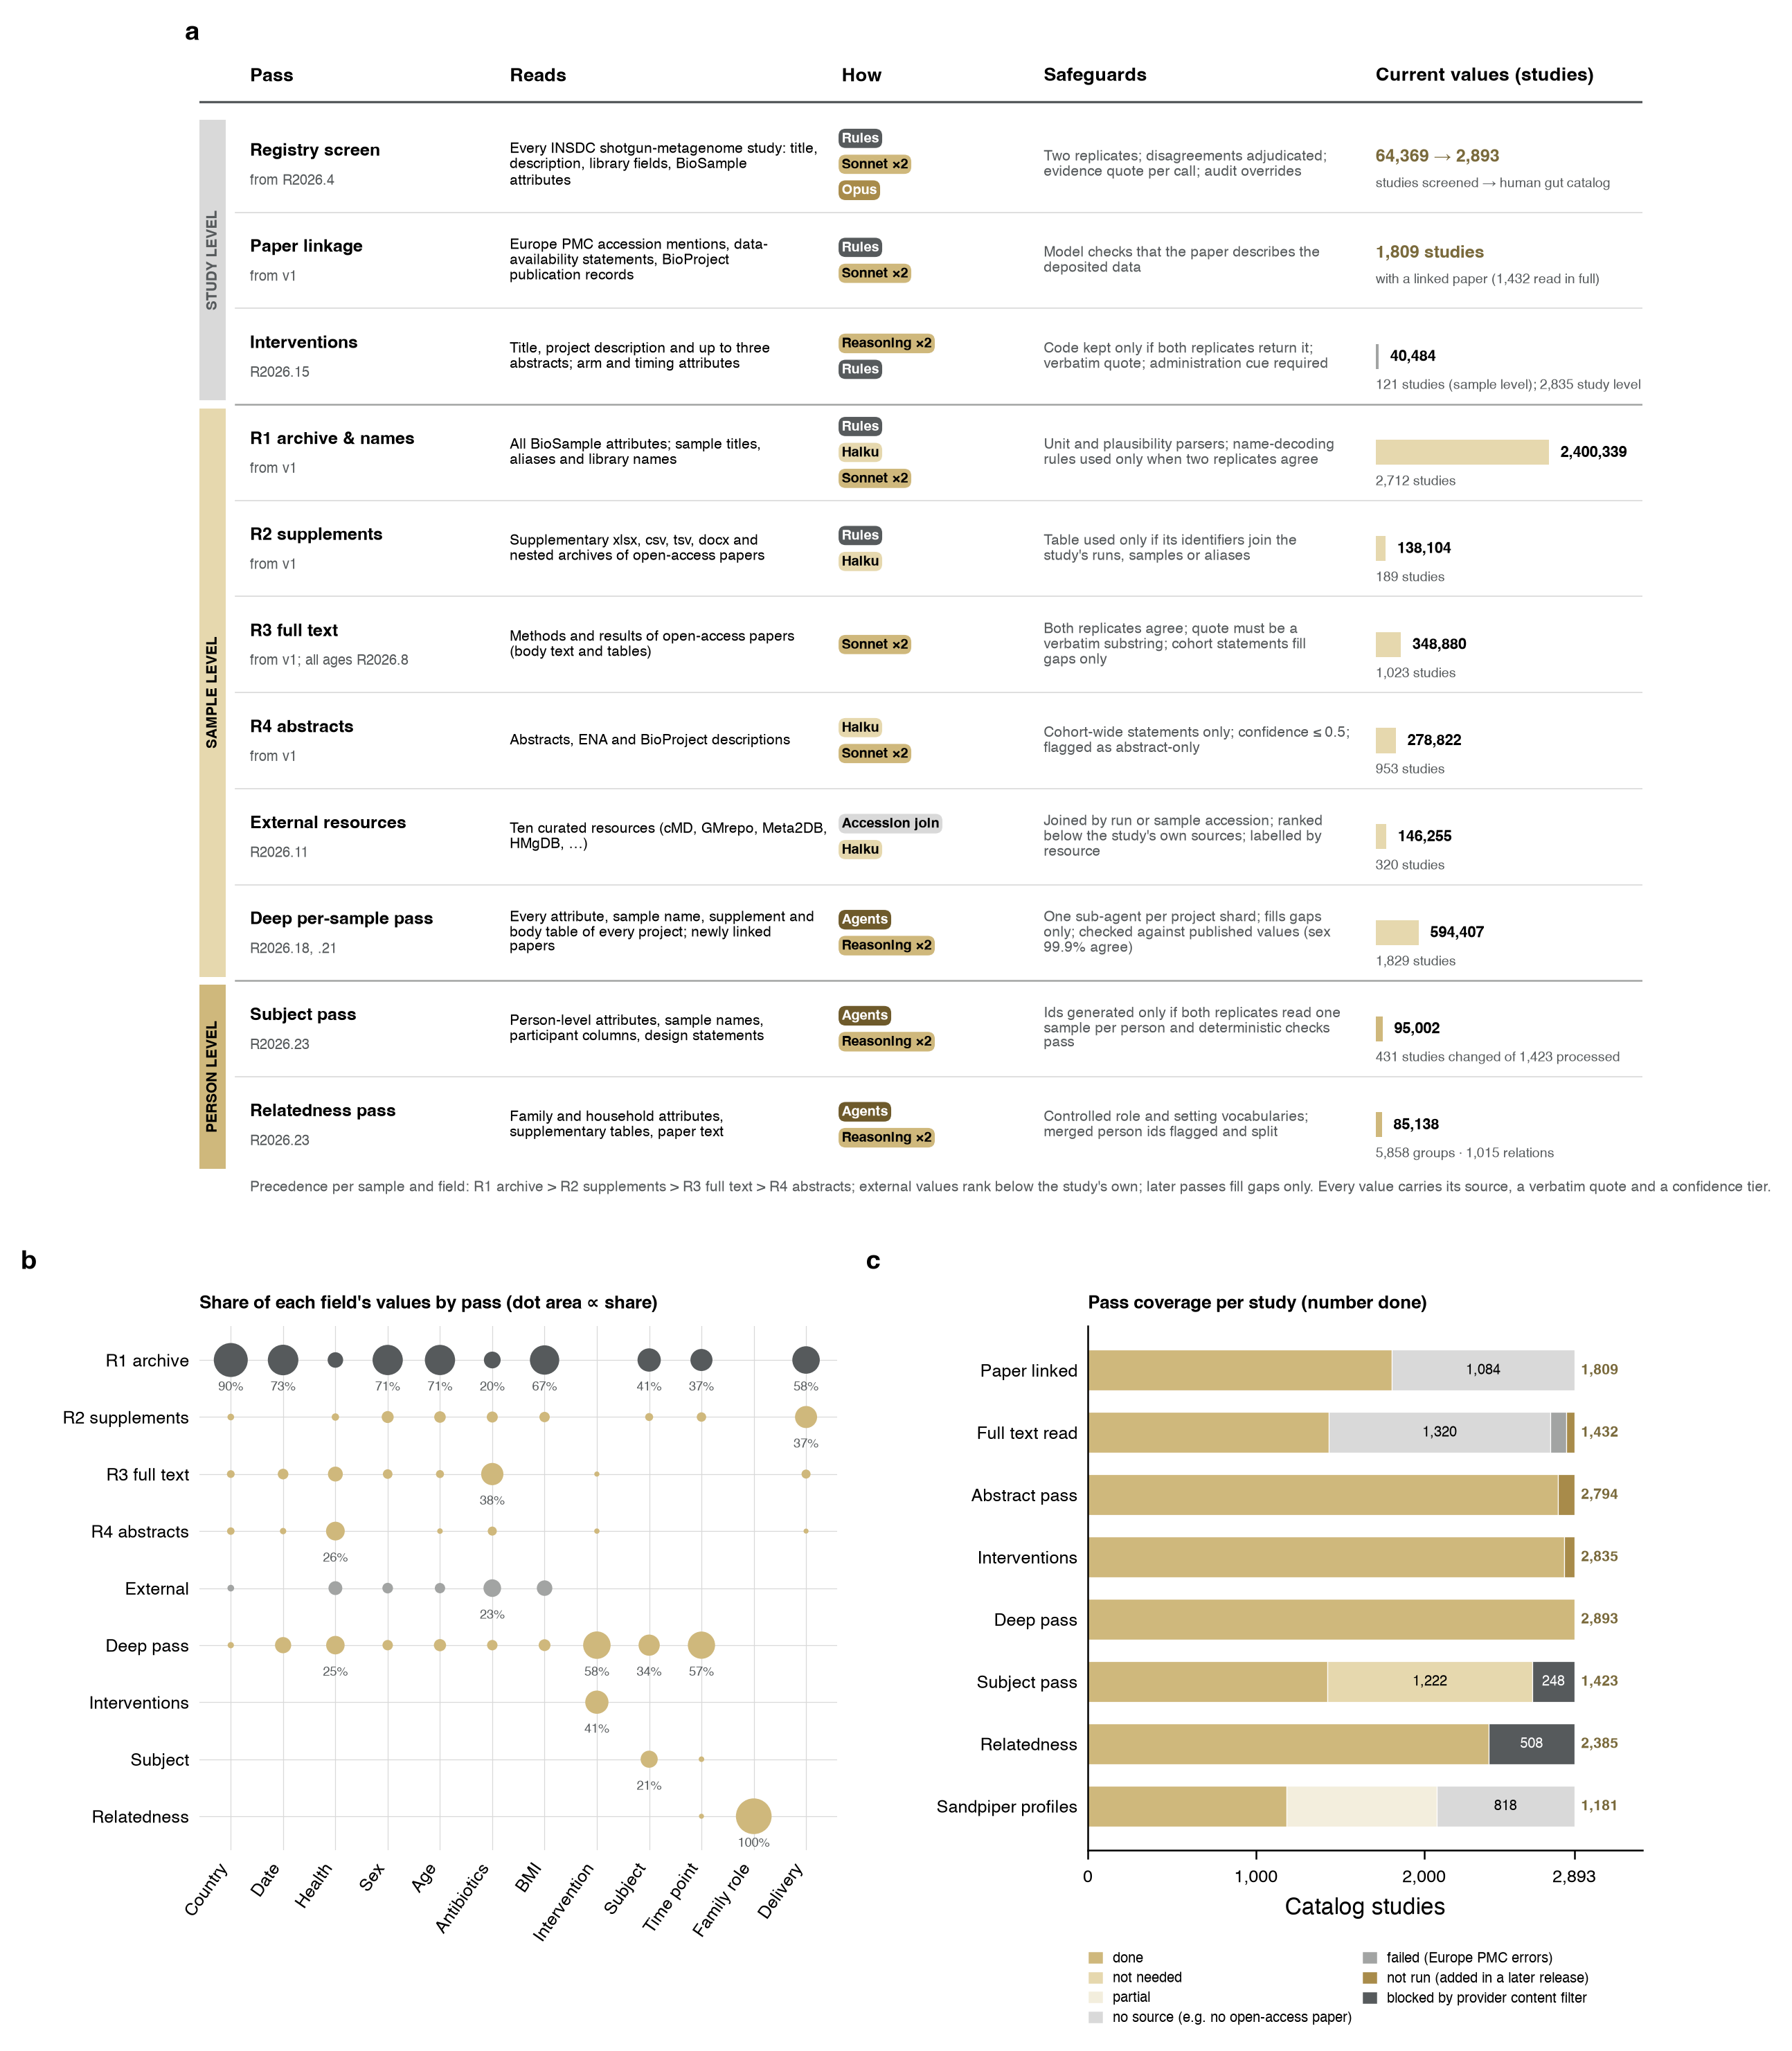
Figure 6. The annotation passes.
Figure 6. The annotation passes. (a) Passes at the study, sample and person level: the sources each pass reads, the methods it uses (rules, Claude Haiku, two independent replicates of Claude Sonnet or of the reasoning model, Opus adjudication, or one sub-agent per project shard), its safeguards and the number of current values it contributes (bars, linear scale) with the number of studies. Values superseded under the precedence rule are not counted. (b) Share of each field's current values contributed by each pass; dot area is proportional to the share. (c) Pass status for each of the 2,893 catalog studies (release R2026.23).

Figures reflect the release they were built from (stated in each caption); numbers on the rest of the site follow the current release.